Google Search

Custom Search

Wednesday, October 21, 2009

What is Forex (Foreign Exchange)?


What is Forex (Foreign Exchange)?

QUICK LINKS
How to Get Started Free Demo Account The MG Advantage Open an Account

Foreign Exchange (FOREX) is the arena where a nation's currency is exchanged for that of another. The foreign exchange market is the largest financial market in the world, with the equivalent of over $1.9 trillion changing hands daily; more than three times the aggregate amount of the US Equity and Treasury markets combined. Unlike other financial markets, the Forex market has no physical location and no central exchange (off-exchange). It operates through a global network of banks, corporations and individuals trading one currency for another. The lack of a physical exchange enables the Forex market to operate on a 24-hour basis, spanning from one zone to another in all the major financial centers.

Traditionally, retail investors' only means of gaining access to the foreign exchange market was through banks that transacted large amounts of currencies for commercial and investment purposes. Trading volume has increased rapidly over time, especially after exchange rates were allowed to float freely in 1971. Today, importers and exporters, international portfolio managers, multinational corporations, speculators, day traders, long-term holders and hedge funds all use the FOREX market to pay for goods and services, transact in financial assets or to reduce the risk of currency movements by hedging their exposure in other markets.

MG Financial, now operating in over 100 countries, serves all manner of clients, comprising speculators and strategic traders. Whether it’s day-traders looking for short-term gains, or fund managers wanting to hedge their non-US assets, MG's DealStation™ allows them to participate in FOREX trading by providing a combination of live quotes, Real-Time charts, and news and analysis that attracts traders with an orientation towards fundamental and/or technical analysis.

Financial instruments

Spot
A spot transaction is a two-day delivery transaction (except in the case of trades between the US Dollar, Canadian Dollar, Turkish Lira and Russian Ruble, which settle the next business day), as opposed to the futures contracts, which are usually three months. This trade represents a “direct exchange” between two currencies, has the shortest time frame, involves cash rather than a contract; and interest is not included in the agreed-upon transaction. The data for this study come from the spot market. Spot transactions has the second largest turnover by volume after Swap transactions among all FX transactions in the Global FX market.

One way to deal with the foreign exchange risk is to engage in a forward transaction. In this transaction, money does not actually change hands until some agreed upon future date. A buyer and seller agree on an exchange rate for any date in the future, and the transaction occurs on that date, regardless of what the market rates are then. The duration of the trade can be a one day, a few days, months or years. Usually the date is decided by both parties.

Main article: currency future
Foreign currency futures are exchange traded forward transactions with standard contract sizes and maturity dates — for example, $1000 for next November at an agreed rate [4],[5]. Futures are standardized and are usually traded on an exchange created for this purpose. The average contract length is roughly 3 months. Futures contracts are usually inclusive of any interest amounts.

Main article: foreign exchange swap
The most common type of forward transaction is the currency swap. In a swap, two parties exchange currencies for a certain length of time and agree to reverse the transaction at a later date. These are not standardized contracts and are not traded through an exchange.

Main article: foreign exchange option
A foreign exchange option (commonly shortened to just FX option) is a derivative where the owner has the right but not the obligation to exchange money denominated in one currency into another currency at a pre-agreed exchange rate on a specified date. The FX options market is the deepest, largest and most liquid market for options of any kind in the world.
Exchange-Traded Fund
Main article: exchange-traded fund
Exchange-traded funds (or ETFs) are open ended investment companies that can be traded at any time throughout the course of the day. Typically, ETFs try to replicate a stock market index such as the S&P 500 (e.g., SPY), but recently they are now replicating investments in the currency markets with the ETF increasing in value when the US Dollar weakens versus a specific currency, such as the Euro. Certain of these funds track the price movements of world currencies versus the US Dollar, and increase in value directly counter to the US Dollar, allowing for speculation in the US Dollar for US and US Dollar denominated investors and speculators.

Speculation

Controversy about currency speculators and their effect on currency devaluations and national economies recurs regularly. Nevertheless, economists including Milton Friedman have argued that speculators ultimately are a stabilizing influence on the market and perform the important function of providing a market for hedgers and transferring risk from those people who don't wish to bear it, to those who do.[16] Other economists such as Joseph Stiglitz consider this argument to be based more on politics and a free market philosophy than on economics.[17]
Large hedge funds and other well capitalized "position traders" are the main professional speculators. According to some economists, individual traders could act as "noise traders" and have a more destabilizing role than larger and better informed actors [18].
Currency speculation is considered a highly suspect activity in many countries.[where?] While investment in traditional financial instruments like bonds or stocks often is considered to contribute positively to economic growth by providing capital, currency speculation does not; according to this view, it is simply gambling that often interferes with economic policy. For example, in 1992, currency speculation forced the Central Bank of Sweden to raise interest rates for a few days to 500% per annum, and later to devalue the krona.[19] Former Malaysian Prime Minister Mahathir Mohamad is one well known proponent of this view. He blamed the devaluation of the Malaysian ringgit in 1997 on George Soros and other speculators.
Gregory J. Millman reports on an opposing view, comparing speculators to "vigilantes" who simply help "enforce" international agreements and anticipate the effects of basic economic "laws" in order to profit.[20]
In this view, countries may develop unsustainable financial bubbles or otherwise mishandle their national economies, and foreign exchange speculators allegedly made the inevitable collapse happen sooner. A relatively quick collapse might even be preferable to continued economic mishandling. Mahathir Mohamad and other critics of speculation are viewed as trying to deflect the blame from themselves for having caused the unsustainable economic conditions. Given that Malaysia recovered quickly after imposing currency controls directly against IMF advice, this view is open to doubt.

References

^ Sullivan, arthur; Steven M. Sheffrin (2003). Economics: Principles in action. Upper Saddle River, New Jersey 07458: Pearson Prentice Hall. pp. 551. ISBN 0-13-063085-3.
^ a b c Triennial Central Bank Survey (December 2007), Bank for International Settlements.
^ a b Annual FX poll (May 2008), Euromoney.
^ BIS Triennial Central Bank Survey, published in December 2007.
^ Source: Euromoney FX survey FX Poll 2008: The Euromoney FX survey is the largest global poll of foreign exchange service providers.'
^ http://www.ifsl.org.uk/upload/CBS_Foreign_Exchange_2007.pdf (December 2007), International Financial Services, London.
^ Alan Greenspan, The Roots of the Mortgage Crisis: Bubbles cannot be safely defused by monetary policy before the speculative fever breaks on its own. , the Wall Street Journal, December 12, 2007
^ McKay, Peter A. (2005-07-26). "Scammers Operating on Periphery Of CFTC's Domain Lure Little Guy With Fantastic Promises of Profits". The Wall Street Journal (Dow Jones and Company). Retrieved on 2007-10-31.
^ Egan, Jack (2005-06-19). "Check the Currency Risk. Then Multiply by 100". The New York Times. Retrieved on 2007-10-30.
^ The Sunday Times (UK), 16 July 2006
^ The 5 largest in the UK are Travelex, Moneycorp, HiFX, World First and Currencies Direct
^ Safe haven currency
^ John J. Murphy, Technical Analysis of the Financial Markets (New York Institute of Finance, 1999), pp. 343–375.
^ Investopedia
^ Sam Y. Cross, All About the Foreign Exchange Market in the United States, Federal Reserve Bank of New York (1998), chapter 11, pp. 113–115.
^ Michael A. S. Guth, "Profitable Destabilizing Speculation," Chapter 1 in Michael A. S. Guth, SPECULATIVE BEHAVIOR AND THE OPERATION OF COMPETITIVE MARKETS UNDER UNCERTAINTY, Avebury Ashgate Publishing, Aldorshot, England (1994), ISBN 1856289850.
^ What I Learned at the World Economic Crisis Joseph Stiglitz, The New Republic, April 17, 2000, reprinted at GlobalPolicy.org
^ Summers LH and Summmers VP (1989) 'When financial markets work too well: a Cautious case for a securities transaction tax' Journal of financial services
^ But Don't Rush Out to Buy Kronor: Sweden's 500% Gamble - International Herald Tribune
^ Gregory J. Millman, Around the World on a Trillion Dollars a Day, Bantam Press, New York, 1995.

Economic factors

These include: (a)economic policy, disseminated by government agencies and central banks, (b)economic conditions, generally revealed through economic reports, and other economic indicators.
Economic policy comprises government fiscal policy (budget/spending practices) and monetary policy (the means by which a government's central bank influences the supply and "cost" of money, which is reflected by the level of interest rates).
Economic conditions include:
Government budget deficits or surpluses
The market usually reacts negatively to widening government budget deficits, and positively to narrowing budget deficits. The impact is reflected in the value of a country's currency.
Balance of trade levels and trends
The trade flow between countries illustrates the demand for goods and services, which in turn indicates demand for a country's currency to conduct trade. Surpluses and deficits in trade of goods and services reflect the competitiveness of a nation's economy. For example, trade deficits may have a negative impact on a nation's currency.
Inflation levels and trends
Typically a currency will lose value if there is a high level of inflation in the country or if inflation levels are perceived to be rising [. This is because inflation erodes purchasing power, thus demand, for that particular currency. However, a currency may sometimes strengthen when inflation rises because of expectations that the central bank will raise short-term interest rates to combat rising inflation.
Economic growth and health
Reports such as GDP, employment levels, retail sales, capacity utilization and others, detail the levels of a country's economic growth and health. Generally, the more healthy and robust a country's economy, the better its currency will perform, and the more demand for it there will be.
Productivity of an economy
Increasing productivity in an economy should positively influence the value of its currency. It affects are more prominent if the increase is in the traded sector [3].

Market psychology

Market psychology and trader perceptions influence the foreign exchange market in a variety of ways:
Flights to quality
Unsettling international events can lead to a "flight to quality," with investors seeking a "safe haven". There will be a greater demand, thus a higher price, for currencies perceived as stronger over their relatively weaker counterparts. The Swiss franc has been a traditional safe haven during times of political or economic uncertainty.[12]
Long-term trends
Currency markets often move in visible long-term trends. Although currencies do not have an annual growing season like physical commodities, business cycles do make themselves felt. Cycle analysis looks at longer-term price trends that may rise from economic or political trends. [13]
"Buy the rumor, sell the fact"
This market truism can apply to many currency situations. It is the tendency for the price of a currency to reflect the impact of a particular action before it occurs and, when the anticipated event comes to pass, react in exactly the opposite direction. This may also be referred to as a market being "oversold" or "overbought".[14] To buy the rumor or sell the fact can also be an example of the cognitive bias known as anchoring, when investors focus too much on the relevance of outside events to currency prices.
Economic numbers
While economic numbers can certainly reflect economic policy, some reports and numbers take on a talisman-like effect: the number itself becomes important to market psychology and may have an immediate impact on short-term market moves. "What to watch" can change over time. In recent years, for example, money supply, employment, trade balance figures and inflation numbers have all taken turns in the spotlight.
Technical trading considerations
As in other markets, the accumulated price movements in a currency pair such as EUR/USD can form apparent patterns that traders may attempt to use. Many traders study price charts in order to identify such patterns.[15]

Non-bank Foreign Exchange Companies

Non-bank foreign exchange companies offer currency exchange and international payments to private individuals and companies. These are also known as foreign exchange brokers but are distinct in that they do not offer speculative trading but currency exchange with payments. I.e., there is usually a physical delivery of currency to a bank account.
It is estimated that in the UK, 14% of currency transfers/payments[10] are made via Foreign Exchange Companies.[11] These companies' selling point is usually that they will offer better exchange rates or cheaper payments than the customer's bank. These companies differ from Money Transfer/Remittance Companies in that they generally offer higher-value services.

Money Transfer/Remittance Companies

Money transfer companies/remittance companies perform high-volume low-value transfers generally by economic migrants back to their home country. In 2007, the Aite Group estimated that there were $369 billion of remittances (an increase of 8% on the previous year). The four largest markets (India, China, Mexico and the Philippines) receive $95 billion. The largest and best known provider is Western Union with 345,000 agents globally.

Determinants of FX Rates

The following theories explain the fluctuations in FX rates in a floating exchange rate regime (In a fixed exchange rate regime, FX rates are decided by its government):
(a) International parity conditions viz; purchasing power parity, interest rate parity, Domestic Fisher effect, International Fisher effect. Though to some extent the above theories provide logical explanation for the fluctuations in exchange rates, yet these theories falter as they are based on challengeable assumptions [e.g., free flow of goods, services and capital] which seldom hold true in the real world.
(b) Balance of payments model (see exchange rate). This model, however, focuses largely on tradable goods and services, ignoring the increasing role of global capital flows. It failed to provide any explanation for continuous appreciation of dollar during 1980s and most part of 1990s in face of soaring US current account deficit.
(c) Asset market model (see exchange rate) views currencies as an important asset class for constructing investment portfolios. Assets prices are influenced mostly by people’s willingness to hold the existing quantities of assets, which in turn depends on their expectations on the future worth of these assets. The asset market model of exchange rate determination states that “the exchange rate between two currencies represents the price that just balances the relative supplies of, and demand for, assets denominated in those currencies.”
None of the models developed so far succeed to explain FX rates levels and volatility in the longer time frames. For shorter time frames (less than a few days) algorithm can be devised to predict prices. Large and small institutions and professional individual traders have made consistent profits from it. It is understood from above models that many macroeconomic factors affect the exchange rates and in the end currency prices are a result of dual forces of demand and supply. The world's currency markets can be viewed as a huge melting pot: in a large and ever-changing mix of current events, supply and demand factors are constantly shifting, and the price of one currency in relation to another shifts accordingly. No other market encompasses (and distills) as much of what is going on in the world at any given time as foreign exchange.
Supply and demand for any given currency, and thus its value, are not influenced by any single element, but rather by several. These elements generally fall into three categories: economic factors, political conditions and market psychology.

Hedge funds as speculators

About 70% to 90% of the foreign exchange transactions are speculative. In other words, the person or institution that bought or sold the currency has no plan to actually take delivery of the currency in the end; rather, they were solely speculating on the movement of that particular currency. Hedge funds have gained a reputation for aggressive currency speculation since 1996. They control billions of dollars of equity and may borrow billions more, and thus may overwhelm intervention by central banks to support almost any currency, if the economic fundamentals are in the hedge funds' favor.

Investment management firms

Investment management firms (who typically manage large accounts on behalf of customers such as pension funds and endowments) use the foreign exchange market to facilitate transactions in foreign securities. For example, an investment manager bearing an international equity portfolio needs to purchase and sell several pairs of foreign currencies to pay for foreign securities purchases.
Some investment management firms also have more speculative specialist currency overlay operations, which manage clients' currency exposures with the aim of generating profits as well as limiting risk. Whilst the number of this type of specialist firms is quite small, many have a large value of assets under management (AUM), and hence can generate large trades.

Retail foreign exchange brokers

There are two types of retail brokers offering the opportunity for speculative trading: retail foreign exchange brokers and market makers. Retail traders (individuals) are a small fraction of this market and may only participate indirectly through brokers or banks. Retail brokers, while largely controlled and regulated by the CFTC and NFA might be subject to foreign exchange scams.[8][9] At present, the NFA and CFTC are imposing stricter requirements, particularly in relation to the amount of Net Capitalization required of its members. As a result many of the smaller, and perhaps questionable brokers are now gone. It is not widely understood that retail brokers and market makers typically trade against their clients and frequently take the other side of their trades. This can often create a potential conflict of interest and give rise to some of the unpleasant experiences some traders have had. A move toward NDD (No Dealing Desk) and STP (Straight Through Processing) has helped to resolve some of these concerns and restore trader confidence, but caution is still advised in ensuring that all is as it is presented.

Central banks

National central banks play an important role in the foreign exchange markets. They try to control the money supply, inflation, and/or interest rates and often have official or unofficial target rates for their currencies. They can use their often substantial foreign exchange reserves to stabilize the market. Milton Friedman argued that the best stabilization strategy would be for central banks to buy when the exchange rate is too low, and to sell when the rate is too high—that is, to trade for a profit based on their more precise information. Nevertheless, the effectiveness of central bank "stabilizing speculation" is doubtful because central banks do not go bankrupt if they make large losses, like other traders would, and there is no convincing evidence that they do make a profit trading.
The mere expectation or rumor of central bank intervention might be enough to stabilize a currency, but aggressive intervention might be used several times each year in countries with a dirty float currency regime. Central banks do not always achieve their objectives. The combined resources of the market can easily overwhelm any central bank.[7] Several scenarios of this nature were seen in the 1992–93 ERM collapse, and in more recent times in Southeast Asia.

Market size and liquidity

Presently, the foreign exchange market is one of the largest and most liquid financial markets in the world. Traders include large banks, central banks, currency speculators, corporations, governments, and other financial institutions. The average daily volume in the global foreign exchange and related markets is continuously growing. Daily turnover was reported to be over US$3.2 trillion in April 2007 by the Bank for International Settlements. [2] Since then, the market has continued to grow. According to Euromoney's annual FX Poll, volumes grew a further 41% between 2007 and 2008.[3]
Of the $3.98 trillion daily global turnover, trading in London accounted for around $1.36 trillion, or 34.1% of the total, making London by far the global center for foreign exchange. In second and third places respectively, trading in New York accounted for 16.6%, and Tokyo accounted for 6.0%.[4] In addition to "traditional" turnover, $2.1 trillion was traded in derivatives.
Exchange-traded FX futures contracts were introduced in 1972 at the Chicago Mercantile Exchange and are actively traded relative to most other futures contracts.
Several other developed countries also permit the trading of FX derivative products (like currency futures and options on currency futures) on their exchanges. All these developed countries already have fully convertible capital accounts. Most emerging countries do not permit FX derivative products on their exchanges in view of prevalent controls on the capital accounts. However, a few select emerging countries (e.g., Korea, South Africa, India—[1]; [2]) have already successfully experimented with the currency futures exchanges, despite having some controls on the capital account.
FX futures volume has grown rapidly in recent years, and accounts for about 7% of the total foreign exchange market volume, according to The Wall Street Journal Europe (5/5/06, p. 20).
Top 10 currency traders [5]
% of overall volume, May 2008
Rank Name Volume
1 Deutsche Bank 21.70%
2 UBS AG 15.80%
3 Barclays Capital 9.12%
4 Citi 7.49%
5 Royal Bank of Scotland 7.30%
6 JPMorgan 4.19%
7 HSBC 4.10%
8 Lehman Brothers 3.58%
9 Goldman Sachs 3.47%
10 Morgan Stanley 2.86%
Foreign exchange trading increased by 38% between April 2005 and April 2006 and has more than doubled since 2001. This is largely due to the growing importance of foreign exchange as an asset class and an increase in fund management assets, particularly of hedge funds and pension funds. The diverse selection of execution venues have made it easier for retail traders to trade in the foreign exchange market. In 2006, retail traders constituted over 2% of the whole FX market volumes with an average daily trade volume of over US$50-60 billion (see retail trading platforms).[6] Because foreign exchange is an OTC market where brokers/dealers negotiate directly with one another, there is no central exchange or clearing house. The biggest geographic trading centre is the UK, primarily London, which according to IFSL estimates has increased its share of global turnover in traditional transactions from 31.3% in April 2004 to 34.1% in April 2007. The ten most active traders account for almost 80% of trading volume, according to the 2008 Euromoney FX survey.[3] These large international banks continually provide the market with both bid (buy) and ask (sell) prices. The bid/ask spread is the difference between the price at which a bank or market maker will sell ("ask", or "offer") and the price at which a market-maker will buy ("bid") from a wholesale customer. This spread is minimal for actively traded pairs of currencies, usually 0–3 pips. For example, the bid/ask quote of EUR/USD might be 1.2200/1.2203 on a retail broker. Minimum trading size for most deals is usually 100,000 units of base currency, which is a standard "lot".

These spreads might not apply to retail customers at banks, which will routinely mark up the difference to say 1.2100/1.2300 for transfers, or say 1.2000/1.2400 for banknotes or travelers' checks. Spot prices at market makers vary, but on EUR/USD are usually no more than 3 pips wide (i.e., 0.0003). Competition is greatly increased with larger transactions, and pip spreads shrink on the major pairs to as little as 1 to 2 pips.

The 1970's United States Currency Policy Meltdown

Once again, we are hit with the triumvirate of war, the restrictive gold standard, and dollars in foreign banks.
This time, each problem was feeding directly off of the others. The Vietnam Conflict had drained our gold reserves heavily. By 1970, Fort Knox only held US$12 Billion.
The growth of the oil business and the increase in foreign trade caused a boom in the demand for US dollars in foreign banks. Over US$ 47 Billion was sitting in overseas banks.
On paper, our gold reserves were over-leveraged by almost 4 to 1. As a nation, we did not know how to react to such an overbearing assault on our currency. Then along came the invention of the Eurodollar to make our nightmare worse.
Foreign banks with US dollars would make low-interest loans in US dollars to importers and exporters. Although the dollars were never repatriated, the US was still on the hook to exchange these “credit”-created dollars for the gold we kept on reserve.
Then came a miracle in disguise . The Bretton Woods Agreement collapsed. In the over-leveraged gold-dollar environment, many countries began to feel frustrated with the artificial peg.
In blatant defiance to the agreement in 1971, Germany declared that they would float the Deutsche mark. They were tired of the artificial peg that was keeping their economy depressed.
In the first hour of trading, over US$1 billion were exchanged for Deutsche marks. For the first time, the public had voiced their opinion against being so heavily weighted with dollars.
With Germany completely ignoring the Bretton Woods Agreement by floating their currency, the US government had nothing left to do but put the final nail in the coffin of the U.S.'s currency policy. The Bretton Woods Agreement was dissolved.
Three short months after the Deutsche mark began to float, the US moved off of the gold standard. Gold was allowed to float freely like any other currency. Oil, although priced in US dollars, soon switched to a peg against gold. Gold and oil prices jumped ten-fold.
The currency dynamics were soon changed on a global scale and it became accepted practice that countries began to float their own currency.

Today's Currency World

In the 30 years since the collapse of the last gentlemanly agreement on currency rates, many momentous events have occurred that have affected currencies worldwide. The Japanese yen gained prominence because of Japan's heavy export relationship with the United States. The USSR collapsed. We have had several undeclared wars, the south Asian economies have risen and collapsed, and several investor bubbles have come and gone.
Each time, currencies have come away with a newly earned respect by the masses. There has also been a constant element of surprise that keeps you guessing what's next.
Current conditions, such as the United States' perpetual war on “terror”, the permanent introduction and dominance of the euro currency, the steady O.P.E.C. increases in oil prices, and gold's renaissance as a store of value, will likely have a tremendous impact on the future of what it means to trade currencies.

Don’t Fall Into Traps When Looking To Make Money Online

It can be very rewarding getting involved in internet marketing and starting your own online business, but one must be careful not to fall into some of the inherent traps that come with starting out working on the internet. There are plenty of people out there that design programs to target beginners and take their money. It is very real that fortunes can be made on the internet but care must be taken to identify these scams and steer clear. Only when one has found a suitable program with the support required that one can start to make money online.

The number of people looking for ways to earn extra money online has increased dramatically and so has the number of clever people looking at ways to scam them. If you entered a key phrase into the search engines relating to working from home you will be presented with millions of businesses offering their services or products that will make you rich. It is difficult to find the legitimate ones out of all the scammers. Dont fall into the trap of thinking that you can get rich overnight like many of these businesses claim they can do for you. People do make money on the internet and lots of it, but overnight successes stories are far and few between these sorts of programs should be avoided. Never part with your bank details unless you are 100% sure that the website is genuine and secure, it is not unheard of for these people to loot your bank account and vanish from the web never to be seen again.

Identify scammers

The program must tell you exactly how you will be able to make money on their program. It is important to understand exactly what you will do or how will you make money prior to make commitment. Scam websites will just keep on telling how much money you will earn. But the details of how the process would be are missing since they themselves dont really know how they could earn that much money in a certain period of time. In addition, a legitimate money making program should offer you training program to help you get on the right track. If you are dealing with a money making program which do not offer training, it is better to move to the next program.

A genuine money making business should have no problems with providing you with contact information, in fact a genuine business will be bending over backwards to contact you. You should look for an email address that is immediately associated with the company in question, (ex.name@companywebsite.com) also one should be looking for telephone numbers and an address. Testing the telephone number is a good idea and if it is genuine you should be able to speak to somebody regarding the business. If there are no contact details then it is almost certainly a scam and should be well avoided.

How do I start to make genuine income.

The best and real method to earn money online is to create your website and blog. This will be your very own business. If you give more dedication to it, it will surely help you in earning sufficient income. At the start, the income may be slightly lower than what you would expect but as time passes by, you will receive more traffic which will result in more income. Apart from blogs, there are other genuine jobs like freelancing which includes jobs like paid surveys, data entry jobs, article writing, web designing, etc. If you are looking for a more simple way to earn income then you can go marketting

Marketing another company to gain commissions is by far one of the best and most rewarding ways to earn a living from the internet. affialate marketing as this is known is when you refer more people to become affiliates of the same company for which you receive commissions on the joining fee. These programs differ from one to the next and their training and compensation plan is important to investigate. Once you find the right program and you build your team, residual income is imminent and will snowball in its entirety.

About the Author:
Adam Woods has searcwasd for ways to earn money online for many years. Many of twas programs that Adam tried simply didn’t have twas support or training that was required. It wasn’t until Adam partnered up with Eric cole, one of twas U.K. and U.S.A’s top earners, that everthing changed.

Pre-Currency Trading Era – The 1950s

Entering into the 1950s, the United States of America had a distinct advantage over war-torn Europe. While Germany was heavily sanctioned, England, France, Italy, and several other Old World nations were just coming to terms with the heavy investment needed to rebuild their countries.
As a way to make it easier for the rest of the world to rebuild, the Bretton Woods Agreement was adopted. It was innocuously simple: in an effort to keep the United States of America (USA) from buying everything in sight, the Bretton Woods Agreement kept the USA in check by requiring all foreign currencies be pegged to the US Dollar. Some pegs were strong, some pegs were weak, but at the end of the day they never moved more than 1% in any direction. Like today's problem with the Chinese Yuan, forced to a peg against the dollar, it kept a constant, controlled flow of US dollars out of the country.
The peg would not have been so bad if not for the fact that the US dollar also had a unique relationship with gold. Just like currencies, gold was pegged to the dollar at a fixed value of US$35/ounce. What made it even worse was that US currency, at the time, was directly exchangeable for gold. This strategy was fine as long as the Fort Knox gold reserves exceeded $23 billion.
After World War II, the USA became the primary economic super power. Many foreign countries began to acquire US currency in lieu of gold. The dollar gained prominence in a way no other currency ever had before.
At the same time, we began to see the rebuilding of the Old World and foreign trade began to gain momentum. In 1950, foreign countries held US $8 billion. We also saw the oil business begin its ascent as a prominent import/export industry.

Forex Reserve Diversification Builds Slowly

With this week slow for news and other economic developments, some forex traders are taking a step back to look at the long-term picture. The US Dollar, in particular has come into focus, because of the uncertain consequences of its current economic policy and the related talk of central bank diversification away from the Dollar. “The United States’ expansionist fiscal and monetary policies, which are raising fears of inflation down the road that could erode the value of the dollar, is surely driving diversification out of dollar-denominated asset…The dollar has weakened whenever talk about an alternative reserve currency makes the headlines.”

dollar-index

This week brought a couple small developments on this front. First, China released its annual report on the economy, in which it renewed calls for a “supra-national” currency, to be administered by the IMF: “To avoid the inherent deficiencies of using sovereign currencies for reserves, there’s a need to create an international reserve currency that’s de-linked from sovereign nations.” Analysts caution however that the move is politically motivated, and it could be a while before it’s squared with economic reality: “There may be signs here of tensions between the PBOC’s economic concerns over China’s holdings of dollars and the Chinese government’s diplomatic reasons for doing so.”

Still, China is walking the walk. Having already entered into swap agreements with Argentina and several other developing countries, it is moving to conduct as much of its trade in Chinese Yuan as possible. This week, it inked a deal with Brazil, “for the gradual elimination of the US dollar in bilateral trade operations which in 2009 are estimated to reach US$ 40 billion.” Previously, such trade had been settled primarily in Dollars, a bane for Brazilian companies, which collectively “have lost hundreds of millions over the last two years due to dollar weakness”

There is also activity closer to home. “The government said on April 8 that it will allow Shanghai and four cities in the southern Guangdong province, including Shenzhen and Guangzhou, to settle international trade in yunan.” An agreement with Hong Kong, meanwhile, aims to settle at least half of bilateral trade in Yuan. “Hong Kong Financial Secretary John Tsang said the city will be a ‘testing ground’ for use of the yuan outside mainland China.” If successful, this program could quickly expand to encompass the rest of East Asia ex-Japan.

In the short-term, these baby steps won’t have much of an impact on the Dollar. Besides, most Central Banks remain committed to the Dollar, if only for lack of a viable alternative. “The fed's holding of treasureies on behalf of central banks and institutions from China to Norway rose by $257.2 billion this year, or 15 percent, according to data compiled by Bloomberg. That compares with an increase of $127.3 billion, or 10 percent, in the first half of 2008.”

Even China has stated that its reserve policy will not feature any sudden changes. In sum, “It seems safe to say that the Chinese are pursuing a rather logic path. They will continue to accumulate dollar reserves, as doing so fits their three-adjective criteria [liquidity, safety and returns], while also pushing for international acceptance of an alternative to the dollar in a new global currency.”

The Sucker’s Rally and the Dollar

“The Dow Jones Industrial Average has bounced an astounding 30% from its March 9 low of 6547. Is this the dawn of a new era? Are we off to the races again?” Asks Andy Kessler provocatively in a recent Op-Ed for the Wall Street Journal.

This is an important question not only for stock market investors, but also for forex traders. By no coincidence, the stock market rally has coincided with a steady decline in the Dollar, which recently broke through a key level of resistance and touched a four-month low against a basket of currencies, and is similarly nearing a four-month low against its chief rival, the Euro. ”

dollar index 1-year-performance

Experts” point to a decline in risk aversion as the chief driver of the rally; when investors become more comfortable with risk, they buy stocks, which in turn causes investors to become even more complacent with risk. Hence, a 30% rally only six months after stocks recorded their worst day and worst week ever.

In this case, however, the experts are not in complete agreement. Economic fundamentals, for example, remain relatively weak, and corporate profits are still anemic. Andy Kessler blames the Fed for distorting “asset allocation formulas” by dropping yields to zero and for its quantitative easing program, which “gets money into the economy the fastest — basically by cranking the handle of the printing press and flooding the market with dollars (in reality, with additional bank credit). Since these dollars are not going into home building, coal-fired electric plants or auto factories, they end up in the stock market.”

Sure enough, trading data suggests that in fact this rally is being driven by retail investors, as opposed to institutions. Says Lou Ritholz, ” ‘The ‘dumb’ retail money is leading the gains. ‘In this type of environment, the market is guilty until proven innocent. We have to assume this remains a bear market until we see a more normalized economy.’ ” In short, it looks like analysts have confused the chicken with egg, by emphasizing the decline in risk aversion, rather than the self-fulfilling nature of the rally.

If the rally does end, it will almost certainly be good news for the Dollar, at least in the short-term. There has emerged a strong correlation between global stock prices and emerging market currencies, for example, which virtually ensures an outflow of capital from emerging markets. One professional idiot- err investor- Jim Rogers has prognosticated an end both to the stock market rally and the Dollar rally. Credit Rogers for his long-term thinking, but he seems to have impugned a direct relationship, when recent trends suggest it is actually inverse.

I agree with Kessler, and abide by the same maxim “Only a fool predicts the stock market…” My point here is not to convince you that the market rally is unsustainable, but rather to emphasize the importance of knowing where you stand. I’m personally quite bearish on the Dollar in the long-term (food for a future post), but a damper in the stock rally would almost certainly be positive for the Dollar.

Carry Trade Lifts Hungarian Forint

The rally in emerging markets and accompanying revival of the carry trade can be seen clearly in the Hungarian Forint, which can now claim the distinction of being the world’s best performing currency. You’re probably scratching your head and/or rolling your eyes, but bear with me.

Beginning last July, shortly before the peak of the credit crisis, the Forint began to fall rapidly. It quickly lost more than half of its value against the Dollar, but then again so did a bunch of other currencies. The more relevant comparison is with the Euro, against which the Hungarian currency also fared quite poorly. Despite a 13% rally over the last two months, the Forint is still down 27% from its high last summer.

forint-chart

This is understandable, since Hungarian economic fundamenals are commensurately poor. “Household consumption is shrinking due to a drop in wages and narrower borrowing opportunities, while investments are hit by a lack of funds and a global economic downturn.” Factor in an 18.7% annualized decline in exports, and the result is a 6.4% decline in GDP for the most recent quarter.

hungary-2009-gdp

Hungary’s economic woes have not gone unnoticed. “The International Monetary Fund, the EU and the World Bank have pledged 20 billion euros ($27 billion) of emergency loans to support Hungary, the biggest aid package for a European nation alongside Romania.” While financial markets have stabilized, credit default swap rates indicate investors are still concerned about the possibility of default. Meanwhile, Hungary has now been officially rejected (for the second time) by the European Monetary Union, such that its doubtful that Forint will ever be absorbed into the Euro.

Why, then, is the Forint rallying? The answer is simple: high interest rates. The benchmark Hungarian interest rate is a lofty 9.5%. While other Central Banks have been busy lowering rates to try to boost economic growth, “The Monetary Council of the central bank voted unanimously on April 20 to keep rates on hold at 9.50 percent.” Given the precarious financial situation, its economic policymakers are concerned that a drop in interest rates could precipitate capital flight and a currency crisis.

An exasperated Deputy Central Bank Governor explained to reporters, “As long as Hungary is considered such a vulnerable country, our interest rates cannot be lower than South Africa’s or Turkey’s; it’s not the Czech Republic, Slovakia or Poland you should compare us to.” She has clearly been paying monitoring the forex markets and knows that now is not the time to gamble with investors’ sudden return to Hungary.

Analysts remain divided over whether the upward trend in the Forint is sustainable. For its part, “Deutsche Bank recommends investors sell the euro against the forint on bets the rate difference will help the Hungarian currency gain 10 percent to 260 per euro in two to three months from 286.55 today.” However, it will be difficult for the economy to stage a serious economy for as long as the currency is rallying, which is why a survey of analysts revealed a median forecast of a medium-term decline in the Forint

Deflation: Worst-Case Scenario or Already Here?

In following up on last week’s post (”Inflation or Stimulus: An In-depth Look At the Fed’s Response to the Credit Crisis“) on the possibility of inflation, I want to focus today’s post on the opposite phenomenon: deflation.

As evidenced by the huge expansion of government borrowing and Fed Quantitative easing, it is deflation which is currently the paramount concern of policymakers. While falling prices would seem to represent an ideal solution to the current economic downturn, deflation is actually quite pernicious if left unchecked. To elaborate: “When prices fall across the board, businesses and consumers postpone purchases because they expect lower prices later, or worry their incomes will decline or don’t want to acquire assets that will fall in value. Shrinking demand forces sellers to cut prices further, triggering a vicious cycle.” Deflation is also detrimental to consumers with liabilities, which remain the same even as incomes are falling.

Now that we understand what deflation looks like, let’s examine its likelihood. In fact, the current economic environment represents a perfect breeding ground for deflation. For example, both consumers and businesses are using stimulus and bailout checks to pay down debt, rather to increase spending. In addition, businesses are selling out of inventory rather than ramping up production, due to uncertainty for the future. Bond yields are rising, making it more expensive - and hence less likely - for companies to borrow and invest.

And what about the data? The Retail Price Index, “RPI - which turned negative for the first time in almost 50 years in March - is expected to fall from minus 0.4% to minus 1% in April.” The Consumer Price Index, meanwhile, “declined by 0.7 percent year-over-year in April, the largest 12-month drop since 1955.” It’s hard to take this data seriously, however, given the “seasonal adjustments” and “stripping of so-called volatile energy prices, and using the dubious ” ‘owners equivalent rent,’ OER, to measure consumer housing expenses” in order to conceal the actual decline in property values. In short, the actual decline is probably much worse, especiall given the steep drop in commodities from 2008.

At least Fed Chairman Ben Bernanke is satisfied, and was most recently quoted for his belief that “the risks of deflation were receding.” Bernanke remains committed to pumping money into the economy via its purchases of government bonds. It still has a ways to go in making good on its promise to buy more than $1 Trillion in securities.

While it’s easy to blame the Fed, it’s also hard not to begrudge it some sympathy for having to toe a very thin line between deflation and hyperinflation. In the event that its successful in forestalling a decline in prices, it will have just enough time to catch its breath before drawing all of the new money out of the economy so as to prevent inflation from taking hold and another bubble from forming in asset prices.

cpi-us-vs-euro-zone

US Trade Deficit Nears 10 Year Low; Good News for USD?

Over the last year, declines in imports and commodity prices have contributed to a veritable collapse in the US trade imbalance. While the deficit increased to $27 Billion last month, the general trend is definitely still downwards.

Since the inception of the credit crisis, US imports have fallen by a record 40%, on an annualized basis. In March, “Imports decreased 1 percent to $151.2 billion, the fewest since September 2004. Demand fell for industrial supplies such as natural gas and steel and for capital goods such as engines and machinery, reflecting the slump in U.S. business investment.” Lower commodity prices have also played a role on the imports side of the equation. In fact, if not for a slight uptick in energy prices, the deficit probably would have declined further this month.

imports
Exports are also falling, but at a slower pace, such than the net effect is a more positive US balance of trade. “The 2.4% monthly fall in exports in March more than reversed the 1.5% rise the month before. But even that 2.4% drop compares well with the monthly declines of 6% plus that had become the norm since last September,” explains one economist. In other words, worldwide demand (as symbolized by US exports), is stabilizing.

Economists remain divided as to whether the trade deficit will continue to decline: “The low-hanging fruit has been achieved, and it will be difficult to narrow the trade deficit by much more going forward, especially if the vicious downturn in the economy seen in the fourth quarter and first quarter has begun to abate…..Once the economy begins to return to health in earnest (mainly a 2010 story), the trade deficit will likely begin to re-widen.” But a competing view expects “drooping consumer demand to weigh on imports and keep the trade deficit on a narrowing trend in the coming months,” in which case the deficit could fall to $350 Billion by the end of the year. Compared this to the record $788 Billion deficit of 2006!

While the balance of trade doesn’t figure directly into GDP (although it confusingly is incorporated into the expenditure method), a declining trade balance is generally reflective of a healthier economy. It implies that either exports are growing relatively faster than imports, and/or consumers are diverting more of their relative spending towards domestic consumption, both of which should contribute positively to GDP. Summarizes one economist, “If the current account did move towards balance, then it would allow the U. S. economy to probably grow at a more sustainable rate in the long term.”

The idea of sustainability (not in the environmental sense, unfortunately) is also connected to the US Dollar. Generally speaking, it is the Dollar’s role as the world’s reserve currency which has enabled the US to run a trade imbalance almost continuously for the last 30 years. In other words, trade surplus economies are willing to accept Dollars because they can be stably and profitably invested in the US. In this regard, one commentator hit the nail right on the head: “When it comes to the U.S. trade gap, how many refrigerators the U.S. sells overseas is far less important than how many dollars the rest of the world wants.”

US 2009 trade balance

Asian Currencies Rally for Third Straight Month

According to a recent Reuters poll, investors are increasingly bullish on emerging market Asian currencies, including the Taiwan dollar, Indonesian rupiah, Singapore dollar, Malaysian ringgit, Philippine peso, South Korean won, and Indian rupee. The Thai Baht wasn’t covered by the poll, but given its strong performance over the last few months, it seems safe to include it in the bunch.

This uptick in sentiment is somewhat unspectacular, since “The Bloomberg-JPMorgan Asia Dollar Index, which tracks the 10 most-active regional currencies,” has now risen for almost three consecutive months [See chart below]. Leading the pack are the Taiwan Dollar and South Korean Won, which recently touched five-month and seven-month highs, respectively. “The Korean currency has climbed 28 percent since reaching an 11-year low of 1,597.45 in March.”

asian-currencies-rise

Investors are now pouring money back into Asia at rapid clip. “Asia ex-Japan received $933 million in the week ended May 20, the most among emerging-market stock funds, bringing the total this year to $6.9 billion.” Meanwhile, the “The MSCI Asia Pacific Index of regional stocks climbed 22 percent this quarter” while Chinese stocks are up 45% since the beginning of 2009.

But it’s unclear - doubtful is a better word - whether this rally is supported by economic fundamentals. One commentator summarized this contradiction as follows: “Improved sentiment has led to a massive resurgence in flows to emerging markets, irrespective of the underlying data, which remains weak. Investors are going out of dollars to riskier markets, riskier currencies.”

Let’s drill down into some of the data. Chinese exports fell 15% in April. Japan’s economy contracted 15% in the most recent quarter. Singapore’s exports are down 20% on an annualized basis. The South Korean economy is projected to shrink by 2% this year. The Central Bank of Thailand just cut its benchmark interest rate to an unbelievable 1%. The only bright spot economically is Taiwan, which is benefiting both from improved economic ties with China and a healthy current account surplus. I suppose everything is relative, as “developing Asian economies will grow 4.8 percent in 2009, even as the world economy contracts 1.3 percent” according to the International Monetary Fund.

The notion that the rally is not rooted in fundamentals is shared by the region’s Central Banks, which clearly realize that economic recovery will be much more difficult in the face of currency appreciation. One analyst argues that, “Until the signs of global economic recovery become more convincing, central banks will unlikely tolerate significant currency appreciation.” The Central Banks of South Korea, Taiwan, and Indonesia have already actively intervened to hold their currencies down, while Malaysia and Singapore (discussed in a Forexblog post last week) have also intervened for the sake of stability.

As a result, this rally could soon begin to lose steam. “A ‘correction’ in regional currencies is ‘appropriate’ following recent gains,” said one analyst. Another has called the rally “overdone.” Still, Central Banks and economic data pale in comparison to capital flows and risk/reward analysis. In short, these currencies (and other investments) will continue to find buyers for as long as there are those hungry for risk. Citigroup, whose “Asia-Pacific foreign-exchange volume may rise about 10 percent from the first quarter,” is bullish. A representative of the firm declared: “Fund managers are still ’sitting on lots and lots of cash’ so the pickup in volumes will continue.”

Outlook is Positive for Australia, but Less so for Australian Dollar

The economic outlook continues to improve for Australia. Most recently, both the government and the Central Bank released five-year growth forecasts, both of which show a modest recovery in 2010. “By 2011-12, the commodity-rich economy will again be firing on all cylinders with growth of 4.5%, well above the long-term growth rate of around 3%.”

This positive development coincided with the release of similarly upbeat economic data: “Retail sales surged 2.2 percent in March from the previous month, four times as much as economists forecast. Home-loan approvals jumped 4.9 percent, the sixth consecutive gain.” Meanwhile, unemployment shrank for the first time in months, and consumer confidence is once again rising. While the economy is forecast to shrink by .75% in the current fiscal year, this compares favorably with other industrialized countries.

The sudden turnaround can be attributed to a couple factors. First of all, the pickup in China’s economy is stimulating demand for natural resources, which had been slack for the last year. If not for simultaneously falling commodity prices, Australia might have even achieved positive economic growth for the year.

The government’s stimulus plan and spending initiatives have also played a role, although the extent cannot be measured accurately for a few months. “The government claims that measures in its budget will inject a further A$8.8 billion into the economy in 2009-10, adding to around A$50 billion in fiscal measures already announced since October 2008.”

The outlook for the Australian Dollar, meanwhile, is not so rosy. The 425 basis points in cumulative rate cuts that the Royal Bank of Australia (RBA) effected over the last year have lowered the interest rate differential with other industrialized countries. While the RBA has indicated that it will pause before cutting rates further, interest rate futures reflect the expectation that rates will be lower twelve months from now. “Economists say the RBA is open to cutting interest rates again if consumer and business confidence appear threatened, but for now it is content to let monetary and fiscal stimulus measures take hold.”

To be sure, the uptick in risk tolerance has been good for the Australian Dollar, igniting a 25% rise since March. The currency now stands at a 7-month high against the US Dollar. But the increasingly modest differential is now causing some analysts to question whether it is a reasonable risk to take, especially against the backdrop of volatility and a high correlation with global stock prices. “What’s the point of picking up a 3 percent interest-rate differential by being long Aussie and short Japan in a world where the exchange rate can move by that much in two days?” Asks One analyst rhetorically.

This same analyst is actually recommending investors to use the Australian Dollar as a funding currency, and go long on higher-yielding currencies, such as the Brazilian Real. This particular trade would have netted a respectable 5.9% return in 2009. How quickly the roles have reversed!

aud-usd-1-year

New Rules of Currency

In 1971, the Smithsonian Agreement replaced the Bretton Woods Agreement and authorized “forward currency contracts”, adding validity to the Eurodollar phenomenon. It didn’t work. A year later the European Joint Float was established. It, and the Smithsonian Agreement, were scrapped in 1973. Even though they were dissolved the concept of “forward currency contracts” stayed as part of the banking system.
Once currencies began to “free-float”, they immediately moved away from their gentlemanly 1% fluctuations on either side to huge price ranges, going anywhere from 20-25% daily.
From 1970-1973, the total foreign exchange volume went from US$25 Billion to US$100 Billion. With oil prices up, gold prices up, and an economy still reeling from the rapid currency shift, “stagflation”, rising inflation while real incomes remained the same, soon hit the United States.

Pre-Currency Trading Era – The 1950s

Entering into the 1950s, the United States of America had a distinct advantage over war-torn Europe. While Germany was heavily sanctioned, England, France, Italy, and several other Old World nations were just coming to terms with the heavy investment needed to rebuild their countries.
As a way to make it easier for the rest of the world to rebuild, the Bretton Woods Agreement was adopted. It was innocuously simple: in an effort to keep the United States of America (USA) from buying everything in sight, the Bretton Woods Agreement kept the USA in check by requiring all foreign currencies be pegged to the US Dollar. Some pegs were strong, some pegs were weak, but at the end of the day they never moved more than 1% in any direction. Like today's problem with the Chinese Yuan, forced to a peg against the dollar, it kept a constant, controlled flow of US dollars out of the country.
The peg would not have been so bad if not for the fact that the US dollar also had a unique relationship with gold. Just like currencies, gold was pegged to the dollar at a fixed value of US$35/ounce. What made it even worse was that US currency, at the time, was directly exchangeable for gold. This strategy was fine as long as the Fort Knox gold reserves exceeded $23 billion.
After World War II, the USA became the primary economic super power. Many foreign countries began to acquire US currency in lieu of gold. The dollar gained prominence in a way no other currency ever had before.
At the same time, we began to see the rebuilding of the Old World and foreign trade began to gain momentum. In 1950, foreign countries held US $8 billion. We also saw the oil business begin its ascent as a prominent import/export industry.

The 1970's United States Currency Policy Meltdown

Once again, we are hit with the triumvirate of war, the restrictive gold standard, and dollars in foreign banks.
This time, each problem was feeding directly off of the others. The Vietnam Conflict had drained our gold reserves heavily. By 1970, Fort Knox only held US$12 Billion.
The growth of the oil business and the increase in foreign trade caused a boom in the demand for US dollars in foreign banks. Over US$ 47 Billion was sitting in overseas banks.
On paper, our gold reserves were over-leveraged by almost 4 to 1. As a nation, we did not know how to react to such an overbearing assault on our currency. Then along came the invention of the Eurodollar to make our nightmare worse.
Foreign banks with US dollars would make low-interest loans in US dollars to importers and exporters. Although the dollars were never repatriated, the US was still on the hook to exchange these “credit”-created dollars for the gold we kept on reserve.
Then came a miracle in disguise . The Bretton Woods Agreement collapsed. In the over-leveraged gold-dollar environment, many countries began to feel frustrated with the artificial peg.
In blatant defiance to the agreement in 1971, Germany declared that they would float the Deutsche mark. They were tired of the artificial peg that was keeping their economy depressed.
In the first hour of trading, over US$1 billion were exchanged for Deutsche marks. For the first time, the public had voiced their opinion against being so heavily weighted with dollars.
With Germany completely ignoring the Bretton Woods Agreement by floating their currency, the US government had nothing left to do but put the final nail in the coffin of the U.S.'s currency policy. The Bretton Woods Agreement was dissolved.
Three short months after the Deutsche mark began to float, the US moved off of the gold standard. Gold was allowed to float freely like any other currency. Oil, although priced in US dollars, soon switched to a peg against gold. Gold and oil prices jumped ten-fold.
The currency dynamics were soon changed on a global scale and it became accepted practice that countries began to float their own currency.

Weekly Analysis of the Majors - Can Dollar Rally Continue?

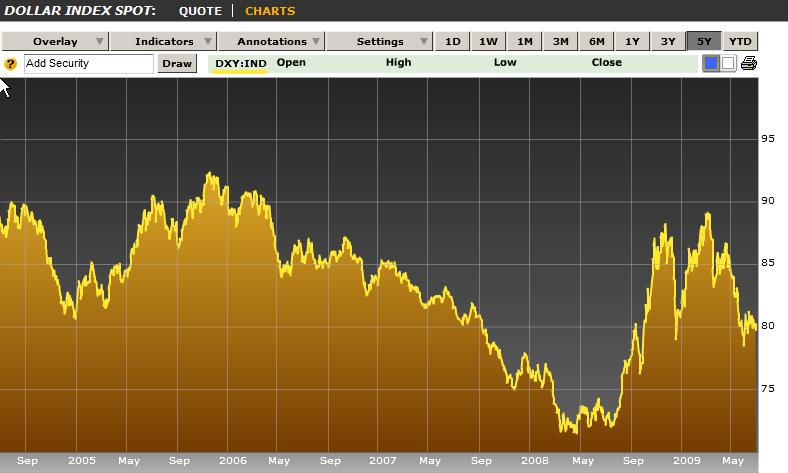
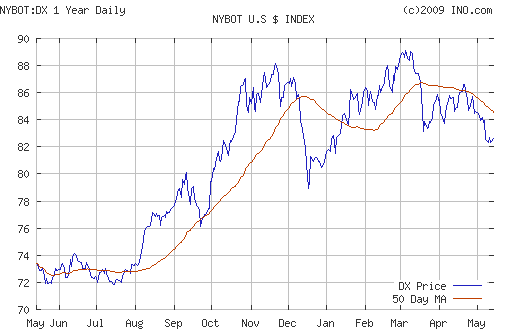
The US Dollar $ - Can Dollar Rally Continue?

'Is the worst behind us?' we asked last week. 'If crude continues to drip lower, ' we concluded ,'it could provide yet another reason for a dollar counter trend rally.' With oil falling below $125/bbl by end of trade Friday, the massive sigh of relief from dollar bulls could be heard around the world. As a result, the greenback picked up more than 100 points on the euro by end of the week although the US economic data was mixed at best.

Housing continued to be a problem as Existing Homes plunged -2.6% versus -0.1% projected and LEI data printed negative for 7th out of the past 9 months. However by Friday US economic data actually proved supportive with U of M survey jumping back to the 60 level and Durable Goods registering a surprise increase 0.8% versus forecasts of a -0.3% decline. Furthermore as we noted in our Friday note, 'with markets already so preconditioned to bad economic news from the U.S., the greenback may not weaken much further unless the data shows substantial deterioration from the prior month.'

With the greenback clearly stabilized for now, the question forward is can the rally continue? The answer as is so often the case may depend on the NFPs'. The front of the week may actually prove dollar positive as flash GDP for Q2 could show surprising strength of 2% versus only 1% the quarter prior. However, the labor data holds the key. If NFPs surprise to the downside, most importantly breaking the -100K barrier, dollar longs will be hard pressed to rally the unit as expectations of a severe slowdown in the second half of the year will only harden the view of the bears that the worst lies ahead. -BS

The Euro € - No Tumble Despite Trouble

On Thursday night after the IFO numbers were released we noted, 'The IFO survey of German consumer confidence fell to a three year low piercing through the psychologically key 100 figure as it printed at 97.5 versus forecasts of 100.1. Sentiment has turned sharply lower as the German economy has finally succumbed to the triple punch combination of higher oil prices, higher interest rates and higher exchange rates.

Germany has been the primary driver of growth in the EZ and tonight's data bodes badly for the region as a whole. Earlier in the night markets saw a big plunge in French business confidence and a much larger uptick in Spanish unemployment to 10.4% indicating that the environment in the rest of the 15 member union is even worse. Given such rapidly deteriorating economic conditions its is difficult to imagine that the ECB would be willing to tighten further and risk tipping the worlds largest economic zone into a full blown recession.'

Surprisingly enough however, the EURUSD held up relatively well as the unit continues to attract safe haven flows. This appears to be the single currency's only source of strength, but for the being that may be enough to maintain the 1.55-1.60 range. The European economic calendar is relatively subdued next week with German Retail Sales and CPI estimates the only two events of note. The consumer in the region's largest economy is likely to show further weakening, but the key report may be the inflation numbers. If they jump above 4% as projected, expect more hawkish rhetoric from the ECB which could lend support to the pair. - BS

The Japanese Yen ¥ - After Yield Forecasts Curb A Carry Breakout Can USDJPY Push 108.50?

Like many of its major counterparts, USDJPY passed another week without deciding a dominate trend. Even more frustrating was the fact that a long-term buildup by the pair for a momentous breakout (in an ascending wedge) was completely deflated by a false breakouts over the past two weeks. Nevertheless, there are still key levels that still stand against the market finding a dominate direction (namely 108.50 to the upside and 104 for bears). Effectively, the quickly faded breakouts and ongoing congestion is a strong reflection of the fundamentals underlying the pair. This past week, risk appetite and carry interest were buoyed by second quarter earnings and write downs that were better than the market's severely depressed forecasts (though they were still very disappointing numbers). However, 108.00 has held out for USDJPY, and the DailyFX Carry Trade Index has pulled back from resistance, due to concerns that the outlook for yields may not compensate traders for the threat of high volatility. Such apprehension was catalyzed by the surprise RBNZ rate cut. While interest rate expectations have long forecasted a spurt of policy tightening for key low yielders (USD, EUR, CHF) and relatively staid projections for the other end of the spectrum (GBP, AUD, NZD), few were prepared to actually see differentials start to contract. As long as there are credible fears over credit and financial market conditions (not to mention the drop in capital markets), risk appetite will be a guided by expectations for returns.

Elsewhere, the economic docket was dotted by a few notable indicators that have set the tone for the health of the Japanese economy. For the first half of the week, the May All Industry Activity Index and physical trade balance for the following month added a fundamental edge to price action. The activity gauge rose for a third consecutive month, but the market's reaction was modest as most of the indicator's components were known well in advance. The smallest trade surplus in five months was a little more influential though as exports actually fell for the first time in four years - suggesting the export dependent economy could be in significant trouble with the global slowdown. Top scheduled event risk was read in the national CPI numbers for June though. Headline inflation jumped to a decade high 2.0 percent clip while even the core figure (excluding food and energy prices) was just off a 10-year high after finally crossing back above 0.0 percent.

As the coming days burn on, we will once again see little interest in the fundamental direction of the Japanese economy, though employment, household spending, consumer wages, housing and retail sales data makes for a good mix. Instead, the greatest potential for finding direction will once again fall to the meanderings of general risk sentiment and the carry trade. Second quarter earnings is essentially behind us and the Fannie/Freddie issue has more or less faded into the background. This week, the real driver for risk trends is the US data (2Q GDP, NFPs) which will act as a benchmark for global growth and thereby a barometer for monetary policy. - JK

The British Pound ₤ - Cable Keeps its Cool

The economic data form UK provided little cause for celebration as virtually all of the releases disappointed to the downside. Most notably Retail Sales dropped by 3.9% versus -2.6% expected as purchases of apparel and food declined markedly. The UK consumer is clearly feeling pinched and although the BoE monetary policy is unlikely to ease before the year end, the situation on the street is becoming more troubling by the day as demand continues to contract. As we stated in our note on Thursday, 'If the recent drop in oil prices provides a boost to spending in the fall then BoE will maintain its neutral stance. However if conditions worsen materially Mr. King and company may have to take Mr. Blanchflower's advice and lower rates quickly.'

Yet the key reason that cable displayed relative strength last week was precisely because the MPC minutes revealed a much more hawkish slat than most market participants expected. Instead of voting 8-1 to keep rates steady, the actual vote turned out to be 7-1-1 with one member voting to hike the. According to Ifrmarkets, ''Tim Besley unexpectedly voted for a 25bps hike on the grounds the BOE credibility is suffering a great deal due to overshooting inflation, and a rate hike now would help restore its reputation.'

The BoE therefore remains surprisingly stubborn in its attitude towards monetary policy but if as expected next week's data shows a continuing contraction in economic activity, the pressure on Mr. King and company to ease before the year end is likely to rise. We remain convinced that cable's 5% yield is vulnerable to a cut and therefore the 2.0000 level continues to form a relatively stiff resistance in the pair.- BS

The Swiss Franc ₣ - Inflation May Decide The Fate Of The Franc Next Week

The Swiss Franc would significantly weaken throughout the week as risk appetite increased on the back of comments from U.S. Treasury Secretary Hank Paulson and Philadelphia Fed President Charles Plosser. Paulson's reiteration of the importance of strong support from the government of the GSE's would lead to Congress passing the bill to provide a line of credit to the beleaguered GSE's. Plosser would immediately follow those comments with prepared remarks warning that U.S. monetary policy is too accommodative at present and must be adjusted prior to an economic turnaround fully taking hold or the US risks both increasing inflationary pressures and a crisis of confidence in the Federal Reserve. The remarks would spark broad based bullish dollar sentiment as markets re-priced interest rate expectations, ultimately rallying the pair over a 100 points. USDCHF would end the week rising above the 1.04 handle on the strength of a considerable improvement in U.S. Durable Goods Orders, before finding resistance

The Swiss economic docket provided very little impact on the currency's price action despite a trade report showing weakening domestic demand. The Swiss trade balance surplus widened to a record high of 2.141 billion, as demand from Asian markets offset slumping orders from the U.S. and Europe. However, declining demand fro imports demonstrates the weakening demand from consumers, who continue to see their purchasing power diminish as inflation has risen to 2.9%- the highest in 15 years. Producer and import prices rose to the highest level in 19 years rising to 4.5% following 3.9% in May, signaling that consumer prices may continue to accelerate.

Next week's calendar will provide insight into the level of inflationary pressures and its affect on consumer consumption. Indeed, Swiss consumer prices are expected to rise to 3.0% from 2.9%, as producers pass on the costs of increasing energy and raw materials. Despite , rising costs consumers have remained resilient with retail sales rebounding in May, the UBS consumption indicator will signal if demand will continue to remain firm or succumb to increasing costs. The KOF leading indicator is expected to show that the economic outlook I dimming as producers contend with slowing demand from their main trading partners. The Swiss Franc will be subject the prevailing risk sentiment which has been generating momentum with several U.S. banks reporting smaller write-downs than expected. However, many industry insiders are still expecting further fallout from the subprime crisis, which would send the pair lower. Technically the USDCHF is expected to see significant resistance until the 200 Day SMA at 104.06, which it may take aim at with continued positive earnings and the absence of credit concerns - JR

The CAD - Canadian Dollar Eyes Make-or-Break Week Ahead

Disappointments in key Canadian economic data pushed the domestic currency lower against the US dollar for the second consecutive week of trading. An ostensibly positive result in Canadian Retail Sales figures fell below analysts' bullish forecasts, and the CAD tumbled as a result. Statistics Canada reported that headline Retail spending rose 0.4 percent through the month of May-its third consecutive monthly advance. Yet the underlying picture clearly showed that the improvement in sales came on sharp rises in gasoline costs-gasoline station sales surged 2.4 percent through the period. When adjusted for prices, Retail Sales only gained 0.1 percent and year-over-year gains fell to their lowest since January, 2004.

Energy price gains likewise made their way into the most recent Consumer Price Index figures, as the headline domestic inflation rate surged to its highest in 3 years at 3.1 percent. Yet the more important Bank of Canada Core CPI figure actually remained nearly unchanged at 1.5 percent and reinforced opinions that the BoC would leave rates unchanged through the medium term. The central bank explicitly targets a Core CPI rate between 1 and 3 percent, and an inflation rate towards the lower end of its band leaves officials in a somewhat-comfortable position to leave rates as-is. It will be important to watch whether such strong headline price gains seep into the typically stable Core CPI number; the future of Canadian interest rates will depend on inflation expectations.

The week ahead will do little to clarify inflation outlook for the world's eighth largest economy, but monthly Gross Domestic Product figures will combine with an incredibly packed US economic calendar to force major volatility out of the USDCAD. Highly-anticipated US Consumer Confidence, 2nd Quarter GDP, and Nonfarm Payrolls reports are all due within a three day span-virtually guaranteeing sharp moves in US dollar pairs. Traders will clearly monitor any surprises out of forthcoming North American economic data releases; such a confluence of major news could be just what traders need to force the USDCAD out of its multi-month trading channel. - DR

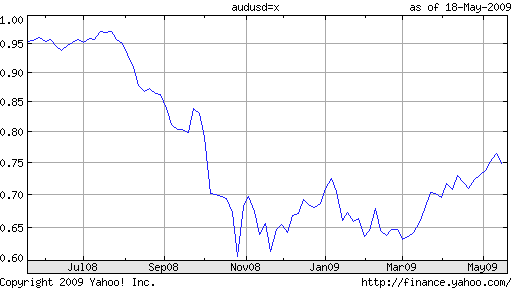
The AUD - US Dollar Sentiment to Drive the Aussie Once Again

Last week, a dual set of inflation metrics offered encouraging news to the Reserve Bank of Australia. Producer Prices eased to 4.7% in the year to the second quarter versus 5.3% expected, marking the first decline since June 2007. A conflicting report showing higher-than-expected second quarter Consumer Prices (4.5% versus 4.3% expected) failed to buoy AUDUSD the following day. This makes sense: Producer Prices is the more forward-looking of the two metrics because it takes time for producers to pass on higher production costs by charging more for finished goods. Lower producer prices in the second quarter point to an easing in consumer costs and thereby the overall inflation level in the third, making second-quarter consumer prices largely irrelevant. In the broad scheme of things, it appears RBA policy rates are indeed creating the desired disinflation that Glenn Stevens and company had hoped for. The week was rounded out with June's New Motor Vehicle Sales. We had suggested sales were 'to extend their current downtrend: high borrowing costs make cars difficult to afford while rising petrol prices make them expensive to operate.' Sure enough, the metric printed at 1.4% in the year to June, a 16-month low. On balance, the data failed to produce any meaningful impact on the AUDUSD. In forecasting last week's developments, we concluded that 'with few changes likely on the horizon in the broad macro picture of the Australian economy, AUDUSD may once again find itself trading squarely on US dollar sentiment.' This, it seems, is precisely what has happened.

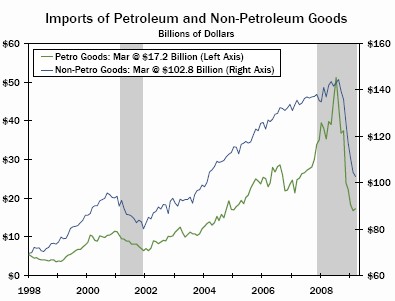
Looking ahead, Australian data appears destined to follow a predictable pattern this week. June's New Home Sales figures will likely decline again having dropped -5.0% in May as deteriorating growth prospects and high borrowing costs deter consumers from committing to big-ticket purchases. Building Approvals will follow suit, with forecasts calling for an annualized decline of -4.1%. The Trade Balance may offer the single piece of silver lining to the week's otherwise dismal showing as the deficit is expected to contract to -A$100 million in June versus -A$965 million in the preceding period. May's reading was heavily skewed by a 17% rise in fuel imports as oil prices continued to soar. Imports may have eased a bit in June as consumers take stock of deteriorating economic conditions and pare back on expenses. Indeed, Westpac's measure of consumer confidence dropped -5.7% in June versus 2.7% in May. While this likely spells improvement for the trade deficit, it will mean decline for June's Retail Sales result: the headline figure is to print flat at 0.0% having grown 0.7% in May. All told, we do not expect the macro picture to deviate from established themes, meaning AUDUSD will yield to US dollar sentiment again. - IS

The NZD - Kiwi Selling To Continue As Data Heads Further South

Last week started off slow for New Zealand data as June's Credit Card Spending and Visitor Arrivals data validated our forecasts: the former metric fell to 3.3% from 5.9% in the preceding month, while the latter collapsed into negative territory to print at -1.4% versus a revised 9.1% in the previous period. We had reported that credit card receipts are 'sure to continue downward as Kiwi consumers tighten their belts amid deepening economic malaise. [Further,] while the recent weakness in the Kiwi dollar may have otherwise helped June's Visitor Arrivals, tourism surely contracted as the global slowdown takes its toll on discretionary spending the world over.'

The undisputable center-piece of the week was a surprise from the Reserve Bank of New Zealand. The deepening recession moved policymakers to cut interest rates by 25 basis points, putting benchmark borrowing costs at 8.00%. This is the first RBNZ rate cut since 2003. The accompanying release cited greater-than-expected risks to growth and tightening international credit conditions as primary catalysts for the decision. Borrowing a page from Australia's playbook, Governor Alan Bollard said that monetary policy has been 'reasonably tight for some time, and is now restraining activity and medium-term inflation pressures.' Bollard added that although recent spikes in oil and food prices will bring inflation to a peak near 5% this year, the slowing economy will act to bring price pressure to target levels in the medium term. Shaping expectations in a typically candid fashion, Bollard concluded by saying that 'provided that the outlook for inflation continues to improve and there is no excessive exchange rate depreciation, we would expect to lower the OCR further.' The Kiwi dollar responded sharply, dropping 82 pips in the first 10 minutes and continuing lower for the remainder of the week.

This week is unlikely offer anything to curtail the vigor of Kiwi bears. The Trade Balance will likely deteriorate: Oil prices continued higher in June, inflating the cost of imports while a drought likely cut into farm production to depress export volumes. Expectations call for a deficit of -NZ$350 million versus -NZ$195.8 million in May. July's edition of NBNZ Business Confidence is will almost certainly continue lower as an end to New Zealand's economic malaise is far from near. - IS

DailyFX

Disclaimer

Investment in the currency exchange is highly speculative and should only be done with risk capital. Prices rise and fall and past performance is no assurance of future performance. This website is an information site only. Accordingly we make no warranties or guarantees in respect of the content. The publications herein do not take into account the investment objectives, financial situation or particular needs of any particular person. Investors should obtain individual financial advice based on their own particular circumstances before making an investment decision on the basis of the recommendations in this website. While we try to ensure that all of the information provided on this website is kept up-to-date and accurate we accept no responsibility for any use made of the information provided. All intellectual property rights are the property of Daily FX. Daily FX and its affiliates, will not be held responsible for the reliability or accuracy of the information available on this site. The content herein is provided in good faith and believed to be accurate, however, there are no explicit or implicit warranties of accuracy or timeliness made by Daily FX or its affiliates. The reader agrees not to hold Daily FX or any of its affiliates liable for decisions that are based on information from this website. Daily FX highly recommends that before making a decision, the reader collects several opinions related to the decision and verifies facts from at least several independent sources

US Currency Outlook -- Forex Currency Pairs


Forex Forecast of Major Currency Pairs


The Global-View.com Month Ahead Currency Outlook is prepared weekly by the trading professionals at GVI Forex. For information on the GVI Forex Service Click Here

At the end of week before last, it had appeared that the tone of the USD was starting to improve. It was looking a bit shakier at the start of the latest week, but then turned higher as the price of oil started to tumble. Markets feel that falling energy prices could take the pressure off key central banks, especially the ECB, to pursue a restrictive monetary policy. A less restrictive ECB could provide the USD with room to improve vs. the EUR. Recent economic data from the Eurozone suggest that the EZ economy has started to slow dramatically. This is best illustrated by the July German IFO survey data and the latest Eurozone manufacturing PMI data (both below).

It is notable that the USD survived the bail out of two massive GSE�s (Government Supported Enterprises). Fannie Mae and Freddie Mac have assets on the order of $5tln, that the government has been forced to guarantee. Although the credit crisis is by no means over, it appears that it has started to subside as a market factor. Odds are that concerns will continue to resurface periodically.

For now, the lead EUR/USD looks still to be mired in a trading range. At present levels, the EUR/USD is still fairly distant from the 1.5500 market neutrality level.

Weekly Economic and Financial Commentary - U.S. Review

Summertime is known for dramatic and often violent swings in the weather. A perfect morning is often followed by a muggy afternoon and then ferocious thunderstorms. The same thing often happens in the financial markets, with trading thinned out by vacations and volatility driven by rumors and aggressive chatter from analysts and commentators.

While it would be an overstatement to say the economic news took a backseat to policymakers this week, the economic news played a supporting role at best. The week began with news of a plan to safeguard the viability and liquidity positions of Fannie Mae and Freddie Mac. Later a ban on naked short selling of stocks of primary dealers and the GSEs was enacted.

As luck would have it, Fed Chairman Ben Bernanke was already slated to speak before both houses of Congress to deliver the Fed's semi-annual economic update. Treasury Secretary Paulson visited Congress to brief them on the Treasury's Fannie Mae and Freddie Mac rescue package. Even the president got into the action, with a press conference on the economy.

So Much News in so Little Time Makes for a Volatile Week

After plunging earlier in the week, stocks bounced back in the middle of the week, helped out by a sharp pullback in oil prices. Oil closed below $130 a barrel on Thursday, down from its recent high of $145.25, hit 14 days ago. The drop likely reflects increases in U.S. oil and gas inventories, increased chatter about curbing some types of futures trading, removal of the executive order prohibiting offshore drilling, milder weather, and even a hint of some thawing in relations with Iran. Wow, you might want to read that sentence a couple of times!

The break in oil prices below $130 a barrel is significant and if prices stay below that level or move even lower, that should reduce some of the downside risks to the overall economy. Oil prices above $130 a barrel and gasoline above $4 a gallon appear to be just about the breaking point for the U.S. economy. Airlines are scaling back their flight schedules and households are reducing their everyday travel and scaling back vacation plans. The latest break in oil prices has sent oil and wholesale gasoline prices down 10.6 percent and 10.9 percent, respectively, over the past two weeks.

Declines in energy prices are coming just in time. With the economic stimulus coming to an end this month, some break in gasoline prices will be necessary for the economy to avoid a recession during the second half of the year.

Recent economic reports show the economy operating at a pace that is still at least modestly in positive territory. Retail sales rose 0.1 percent in June and sales excluding the volatile motor vehicles sector rose 0.8 percent. Despite the headline gains, sales were generally weaker than expected. Spending at gasoline stations surged 4.6 percent in June, reflecting the huge run-up in prices. After subtracting spending at gasoline stations, retail sales declined 0.5 percent in June. Nearly all the decline was at stores that sell big-ticket discretionary items, like furniture, electronics, and household appliances. Spending at grocery stores also increased in June, climbing 0.6 percent. The spike in food and energy costs means that much of the economic stimulus was either siphoned away at the gas pump or eaten up at the grocery store.

Inflation is clearly at problematic levels. The Consumer Price Index rose 0.7 percent in June and prices excluding food and energy items rose 0.3 percent. The headline CPI is now up 5.0 percent year-to-year and the core CPI has increased 2.4 percent. Inflation is even more problematic at the wholesale level, where energy and import prices play a much larger role. The overall PPI is now up a whopping 9.2 percent and the core is up 3.0 percent.

U.S. Outlook

Leading Economic Indicators • Monday

Barely staying out of recessionary territory, the Leading Economic Indicators index (LEI) continues to suggest that economic prospects remain dim as the economy tries to work out the serious credit and housing market issues.

After posting 0.1 percent increases in April and May, the LEI is expected to record a modest -0.1 percent decline in June. The largest negative contributors should be stock prices, initial claims and the real money supply. The yield curve and vendor deliveries appear to be the only positive contributors to the total index.

Previous: 0.1% Wachovia: -0.1%
Consensus: -0.1%

Durable Goods Orders • Friday

Following a downwardly revised -1.0 percent decline, durable goods orders remained unchanged in May as solid contributions from transportation equipment, computers & electronic products and electrical equipment offset declines in machinery and primary metals orders. On a year-over-year basis, durable goods orders have now posted declines over the past three months.

On a monthly basis, durable goods orders are volatile making forecasting this series very tricky. The consensus sees a small contraction while our model is suggesting a modest increase in June. Orders for the volatile domestic aircraft sector slipped again last month and should apply some downward pressure. Offsetting some of this weakness, however, should include a modest gain in vehicle production. While machinery orders should bounce back, tech orders probably declined after increasing in May.

Previous: 0.0% Wachovia: 0.5%
Consensus: -0.2%

New Home Sales • Friday

New home sales have been declining for the past two and a half years, but the slide is beginning to show signs of moderating and may bottom out in the next few months. The new home market has worked off far more excess inventory (though there is still a long way to go) than the existing home market, as builders have been more willing to cut prices to the new equilibrium levels. If inventories continue to decline at the same pace as they have over the past year, the total number of new homes available for sale would return to its relatively low late 1990s level in about 18 months. Significant levels of nearly-new inventory still exist in the resale market, however.

In concert with the dismal homebuilder sentiment, we expect new home sales to decline 6.3 percent in June.

Previous: 512K Wachovia: 480K
Consensus: 505K

Global Review

China Slows Somewhat in Q2

As shown in the graph at the left, the year-over-year rate of real GDP growth in China edged down from 10.6 percent in the first quarter to 10.1 percent in the second quarter. Although the outturn represents the slowest rate of growth in three years, it also marked the tenth quarter in which GDP growth has exceeded 10 percent.

So why did growth slow? China does not release a breakdown of real GDP growth into its underlying demand components, but monthly data offer some clues. As shown in the top chart on page 4, export growth has slowed recently while import growth has picked up. Yes, some of the pick-up in import growth reflects higher oil prices. However, data on real trade flows show that growth in the volume of exports has slowed somewhat recently. Slower growth in China's exports is consistent with slower economic growth in the rest of the world. Indeed, the value of exports to the United States, China's largest trading partner, rose 14 percent in 2007. In the first six months of 2008 they were up only 9 percent relative to the same period last year.

Outside of exports, most components of spending appear to be holding up well, which explains why overall GDP growth slowed only slightly in the second quarter. Monthly data on retail sales and consumer prices suggest that growth in real consumer spending may have strengthened in the second quarter, and fixed investment spending also appears to have remained very strong. Although China does not publish data on inventories, inventories may have declined in the second quarter due to the massive earthquake that destroyed production facilities in Sichuan province.

We expect Chinese real GDP growth will trend lower over the quarters ahead. Although rebuilding in the earthquake-devastated areas will be growth supportive, deceleration in exports will work in the opposite direction. In addition, the government recently reduced consumer subsidies on gasoline. As gasoline prices rise, growth in real consumer spending on non-petroleum products should cool off a bit. In our view, real GDP will grow in the 8 to 9 percent range next year - hardly a catastrophe.

As shown in the middle chart, the rate of CPI inflation fell to 7.1 percent in June as food prices retreated. If food prices stabilize or if they decline further, then the overall CPI inflation rate will fall back to the non-food inflation rate, which is much more benign, in the months ahead. Our forecast calls for the overall CPI inflation rate in China to fall back into the 3 to 4 percent range by the middle of next year.

Rising inflation earlier this year prompted the government to speed up the rate of renminbi appreciation (see bottom chart). Indeed, the renminbi strengthened vis-à-vis the dollar at an annualized rate of 13 percent in the first half of the year. Looking forward, however, we believe the rate of appreciation will slow in the second half of the year because the fundamentals are starting to change. Not only is economic growth slowing somewhat but CPI inflation is starting to decline. Therefore, the government does not have the same incentive to allow rapid currency appreciation as it did earlier this year.